Critique by Dr. Arthur Smith
From Dr. Arthur Smith, American Physical Society
FOR all their faults, the two introductory articles1,2 in the Physics and Society "debate" on climate change in the July 2008 issue both accept the basic scientific conclusion that increased CO2 in the atmosphere, thanks to human activities, results in a "forcing" that adds heat to the Earth, and that will result in warming of the surface. The central question both articles seem designed to address is the magnitude of that warming. Unfortunately both articles fail to make a rational quantitative argument either for (Hafemeister and Schwartz - HS) or against (Monckton) the consensus estimates of the IPCC, that a forcing change equivalent to doubling atmospheric CO2 will result in an "equilibrium climate sensitivity" (a steady-state temperature increase) of 2° to 4.5° K, with a best estimate of 3° K, and very unlikely to be less than 1.5° K3.
In the first article, HS provide a simple quasi-zero-dimensional gray-body model with greenhouse absorption represented by atmospheric layers, and deduce from the observed parameters for Earth that our atmosphere effectively has 60% of a fully-absorbing layer (or a single layer with 76% absorption). This isn't a bad argument (I have used something very similar myself 4) but it tells us little about the numerical impact of doubling CO2. If one accepts the IPCC's 3.7 W/m2 value for the net forcing from a doubling, a value determined by the spectral properties of the CO2 molecule under the conditions prevailing in the atmosphere, then the analog of equation 20 provided by HS gives a temperature response from doubling CO2 of:
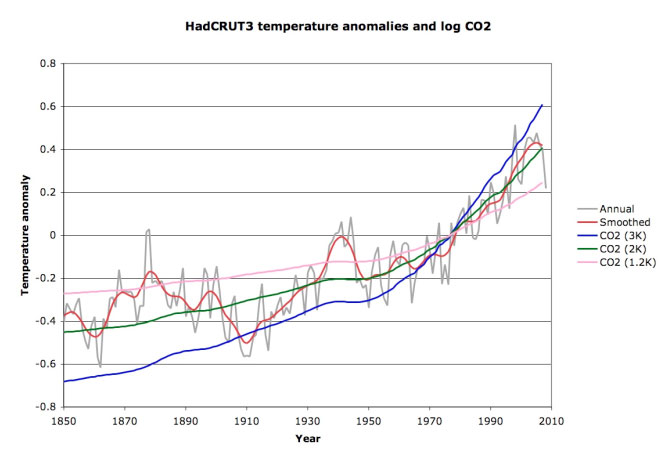
A simple estimate for transient climate response (which is a slightly different number and expected to be less than the equilibrium sensitivity, since some responses, such as ocean warming, are slow) can be found by plotting the historically measured atmospheric CO2 values on the same chart as estimated temperature anomalies, over the past 150 years:
Figure 1: The gray curve is annual average temperature anomaly numbers from the Hadley center5, and in red is the corresponding 21-point smoothed curve. The other three lines plot the logarithm of CO2 concentrations measured at Mauna Loa6 and the 20-year smoothed Law Dome measurements7 multiplied by appropriate sensitivity-to-doubling numbers and adjusted to a 0 average for the HadCRUT3 baseline period 1961 to 1990. Other than the sensitivity number there is no free parameter here; this is entirely derived from observations.
The best fit to observed temperature is for a transient response of about 2K per doubling of CO2. This compares well with the IPCC range of transient climate response of between 1° K and 3.5° K (see section 9.6.2.3 of IPCC AR4 WG1 3). There are certainly confounding factors from the many other forcings discussed at length in the IPCC reports, but the fact that the 20th century rise in temperatures was not only correlated with the increase in CO2 concentrations, but was of almost exactly the expected size is pretty strong evidence that the IPCC's transient and equilibrium climate sensitivity numbers match reality. In particular, the equilibrium sensitivity just from this comparison is surely not as low as the 1.1° K found with no feedbacks, and nowhere near the 0.6° K that Monckton claims.
Aside from the introductory and concluding polemics (most of the "issues" raised are well addressed in the standard lists of arguments from "skeptics", for example at http://www.skepticalscience.com/), Monckton's paper again focuses on the sensitivity question, and, with a few oddities, represents the basic analysis of the IPCC estimate quite well. Monckton's calculation of the forcing from doubled-CO2 (Table 1 and surrounding discussion) is wrong, however - the meaning of doubled CO2 is precisely that, and the 3.7 W/m2 value for the forcing in his equation 1 is correct, not the 3.4 W/m2 obained in equation 4. Monckton appears to have confused predictions for 20th century greenhouse gas increases and their "equivalence" to a corresponding level of CO2 increase, while not realizing that equivalence is defined by the degree to which they provide the same forcing.
In another oddity, Monckton appears not to have used his equations 4 and 5 to derive the value of the base sensitivity, κ. Given the Hansen/IPCC claim mentioned there of 1.2° to 1.3° K base sensitivity to doubling, for a forcing of 3.4 W/m2, κ would be 0.35 to 0.38 K W-1m2, or for the more correct 3.7 W/m2, the value would be in the range 0.32 to 0.35. The review by Bony et al8 does suggest the best value (based on climate model integrations holding "everything" constant except the CO2 concentrations) is slightly less than that, the inverse of the 3.2 W m-2 K-1 uniform-temperature radiative cooling response.
In the final oddity in his discussion of the IPCC approach, Monckton mistakenly adds a CO2 feedback (an additional 0.25 W m-2 K-1 - a value that relies on the doubling forcing being 3.7 W/m2!) to the response to CO2 doubling. In fact, by definition, any CO2 doubling already includes whatever CO2 feedback there may be. The doubling is not assumed to be purely anthropogenic, but it may have some natural component (in fact when looking at paleoclimate records it is entirely natural). The feedback sum b then should be about 1.9, not 2.16 W m-2 K-1 (Monckton's equation 12) giving a feedback factor f of about 2.5, not 3. The correct form of Monckton's equation 14 is then:
Less forgivable are the errors in the "reconsidered" sections of Monckton's article, which follow. The claim that "[laboratory] experiments are, however, of limited value when translated into the real atmosphere" at the start is not promising - it is essentially an argument that basic physical properties of matter (in this case the extremely well-measured spectral properties of the gaseous constituents of the atmosphere) cannot be extrapolated from the laboratory to the "real world". Not the sort of position I would think a physicist would accept lightly!
The entire "radiative forcing reconsidered" section argues not about forcing at all, but about the temperature changes expected from forcings. Monckton ends by claiming he can divide the 3.7 W/m2 forcing from doubling CO2 by a factor of 3 because a certain temperature response is low - but this has nothing to do with the forcing at all, which is completely determined by the underlying physics. If anything, this section is an argument about feedbacks - but it is not phrased in that way, and so at the least is highly confusing.
Monckton's entire argument here, also, is based on a claim that certain patterns of temperature change are characteristic (fingerprints, as he puts it) of different forcings. To show this he culls a figure from the IPCC report (Monckton's figure 4, IPCC AR4 WG1 figure 9.1 3) which is discussed at length in section 9.2.2.1, "Spatial and Temporal Patterns of Response" in the IPCC WG1 report. Monckton, however, completely mischaracterizes the nature of the "fingerprints" involved. For one thing, the image is based on estimates of forcing changes from 1890 to 1999, so because the largest change has been in greenhouse gas concentrations, it naturally shows the strongest pattern. The tropical mid-troposphere "hot spot" that Monckton highlights is present in all the positive forcings (sun, greenhouse gases, ozone), and it's similarly a "cold spot" in the negative forcings (aerosols, volcanoes). For example, in the case of solar forcing, the IPCC contour plot shows that the surface warms somewhere between 0° and 0.2° K while the mid-troposphere warms somewhere between 0.2° and 0.4° K which suggests an amplification factor of at least the 2° to 3° that Monckton claims for the greenhouse gas forcing case. Again, the only reason it looks so "hot" in the greenhouse gas picture there is because that is where the largest forcing change has been. These ../images were not scaled to equivalent forcings. And the text of section 9.2.2.1 makes clear: "Solar forcing results in a general warming of the atmosphere with a pattern of surface warming that is similar to that expected from greenhouse gas warming, but in contrast to the response to greenhouse warming, the simulated solar-forced warming extends throughout the atmosphere."
That is, the actual signature of greenhouse gas-caused warming, the "fingerprint" if you will, as distinct from a change in solar irradiance, is cooling of the upper atmosphere (stratosphere) while warming the surface. For a change in the sun, in contrast, all of the atmosphere warms. This differential in temperature change is very definitely observed, as Monckton's figure 6 shows: strong warming at the surface, and cooling at the top of the atmosphere. This is one of the strongest proofs that greenhouse gases are behind the warming we've seen.
Now, the theory of moist adiabatic lapse rates9 implies that the tropical mid-troposphere should warm more than the surface (the lapse rate should decrease) under any forcing that warms the surface, related to the increase in water vapor. Monckton contradicts himself on this point, stating here that "the concentration of water vapor in the tropical lower troposphere is already so great that there is little scope for additional greenhouse-gas forcing" while both before and after noting that increasing temperatures allow for exponentially increasing water vapor concentrations. Which is it? The observations are still being disputed, as even Monckton admits by refering to the wind-based measurements of Allen et al. Whatever the measurements and theory sort themselves out to on this, note again that tropical mid-troposphere temperature trends have no relevance to any specific "signature" of greenhouse gases, and this whole argument has no bearing on the forcing that Monckton claims it does.
In other words, Monckton has not made any case for arbitrarily dividing the forcing by 3 as in his equation 17. That would require drastically changing the spectroscopic properties of atmospheric constituents, for which there is certainly no justification in the arguments presented.
The second "reconsidered" section unfortunately builds on the minor errors made in the initial discussion of the no-feedback and feedback parameters. Since the value of f for IPCC (2007) is certainly close to 2.5 rather than the 3 Monckton found, and given also the incorrect value of b, the entire discussion here is pretty much void. The claim that IPCC 2001 strongly advocated for a value of λ = 0.5 K W-1m2 seems unlikely given the phrasing and the fact that this number is essentially the central question of sensitivity, which was almost unchanged from IPCC 2001 to IPCC 2007. In any case, that value does produce a value of the feedback parameter f close to (slightly less than) 2.0, and the resulting value for κ is about 0.26, almost precisely the "characteristic emission level" value that Monckton quotes later (after equation 21). Indeed, the naïve Stefan-Boltzmann argument here is only valid when considered at the "characteristic emission level", because that is also roughly where the forcings are relevant (the extra 3.7 W/m2 is at the top of the troposphere, not at the surface). The actual value of about 0.31 is obtained from more complex radiative calculations as explained by Bony et al8. In any case, 0.26 and 0.31 are hardly very far apart, even if Monckton makes much of perceived discrepancies of this sort in his table 2. It is also once again odd that he doesn't include in that table the simple calculations that would give larger numbers than 0.31! The authors of the various reports could certainly have made themselves clearer about what they were assuming in this regard, it would have helped to avoid this sort of confusion - but really, this is only a 20% effect at best.
In several places Monckton refers to McKitrick's claims that temperature anomaly measurements are off by a factor of two. This is hardly an accepted position, but even McKitrick only claims it for land measurements (his issue is the "urban heat island" effect). Since most of Earth's surface is water, Monckton's repeated assumption that he can just divide the measured anomalies by two to get a McKitrick number is clearly wrong. The corrected form of Monckton's equation 26 just uses the NCDC values (and the proper value for b):
Finally, on the feedback factor f, Monckton argues that the high-end ranges of individual feedbacks must be too high because adding them all up leads to instability. Certainly nobody has argued that Earth's climate is fundamentally unstable in that regard. He makes one mistake here by choosing incompatible values for water vapor and lapse rate feedbacks. In fact, those two feedbacks are closely linked, and the uncertainty in their sum is less than their individual uncertainties, as explained in IPCC AR4 WG1 section 8.6.2.3, and also by Bony et al8: "the spread of the combined water vapor -lapse rate feedback is roughly half that of the individual water vapor or lapse rate feedbacks". Also, assuming those are 95% certainty intervals, the chances of four or five of them being as high or higher than their maximum is less than one in a million; the issue of instability under those unlikely conditions is simply not relevant to the remainder of the estimates, and there is no reason from this to think the central estimates of those feedbacks are overstated.
Monckton makes an additional odd charge at the end here that the entire feedback analysis is invalid because the climate system is nonlinear. Perhaps he is unaware that even nonlinear systems can be linearized under small perturbations? It should also be noted that actual climate model runs don't make any assumptions about linearity, they are treating the full physical system to the extent computational limitations allow, and the approximate feedback numbers in the IPCC reports are based on these full computations, not on initial linearization assumptions. In any case, his example of nonlinearity is even odder: "The water-vapor feedback is an interesting instance of the non-linearity of temperature feedbacks. The increase in water-vapor concentration as the space occupied by the atmosphere warms is near-exponential; but the forcing effect of the additional water vapor is logarithmic." But when you combine the exponential rise in water vapor with a logarithmic forcing function, you end up with a linear feedback of the forcing on temperature directly, no need to linearize in perturbative fashion at all!
All of Monckton's efforts on these last two "reconsiderations" only cut the sensitivity by 30 to 40%. It is only Monckton's arbitrary slashing of the forcing from doubling CO2 by a factor of 3 that brings his estimate for sensitivity out of the IPCC range, as low as the 0.6 K of his equation 30. In fact, the value of the forcing is the most solidly established number of them all, and has nothing to do with tropical vs. extra-tropical climates as Monckton claims toward the end. The IPCC's estimates for climate sensitivity are based on simple sound analysis and modeling of the basic physics; Monckton's claims that IPCC got it wrong are without merit.
I am grateful to Dr. Joel Shore for comments on a draft of this letter.
1. David Hafemeister and Peter Schwartz: "A Tutorial on the Basic Physics of Climate Change", Physics and Society, 37, issue 3, p. 3 (2008)
2. Christopher Monckton: "Climate Sensitivity Reconsidered", Physics and Society, 37, issue 3, p. 6 (2008)
3. IPCC, 2007: Climate Change 2007: The Physical Science Basis. Contribution of Working Group I to the Fourth Assessment Report of the Intergovernmental Panel on Climate Change [Solomon, S., D. Qin, M. Manning, Z. Chen, M. Marquis, K.B. Averyt, M.Tignor and H.L. Miller (eds.)]. Cambridge University Press, Cambridge, United Kingdom and New York, NY, USA.
4. Arthur Smith: "Proof of the Atmospheric Greenhouse Effect", arXiv:0802.4324v1
5. Hadley Center temperature series: http://hadobs.metoffice.com/hadcrut3/diagnostics/global/nh+sh/annual
6. Mauna Loa CO2 series: ftp://ftp.cmdl.noaa.gov/ccg/co2/trends/co2_annmean_mlo.txt
7. Law Dome CO2 series: http://cdiac.ornl.gov/ftp/trends/co2/lawdome.combined.dat
8. S. R. Bony et al.: "How well do we understand and evaluate climate change feedback processes?", Journal of Climate, p. 3445 (2006).
9. B. D. Santer et al., "Amplification of Surface Temperature Trends and Variability in the Tropical Atmosphere" Science, 1551 (2005).
Arthur Smith
Selden, NY
apsmith@aps.org
Monckton's Rebuttal
From The Viscount Monckton of Brenchley
DR. Arthur Smith's critique of my paper Climate Sensitivity Reconsidered (Physics & Society, July 2008) begins ad hominem, saying most "issues" in my "introductory and concluding polemics" are "well addressed in the standard lists of arguments from 'skeptics'". Yet I introduced my paper not with a "polemic" about "issues" but with a heavily-referenced list of the models' failures to represent the observed climate, not least the downtrend in global temperature since late 2001. In June 2008 global temperature was cooler than when Dr. Hansen started the "global warming" hare with his testimony to Congress 20 years previously. Dr. Smith's pejorative use of the word "skeptics" is regrettable: as Huxley said, it is the duty of scientists to be skeptical. How would Dr. Smith like it if I said he has a vested interest in the climate bugaboo as a founder of the "Alternative Energy Action Network", whose website recommends the serially-inaccurate RealClimate blog as though it were reliable? Let us debate ad rem.
Dr. Smith proceeds to question the description of the IPCC's method of evaluating climate sensitivity in the first half of my paper, starting with a novel proposition that net anthropogenic forcing at CO2 doubling is 3.7 W m -2. Yet, in two ways, IPCC (2007) makes it clear that this value applies to the forcing from CO2 only (Figure 1):
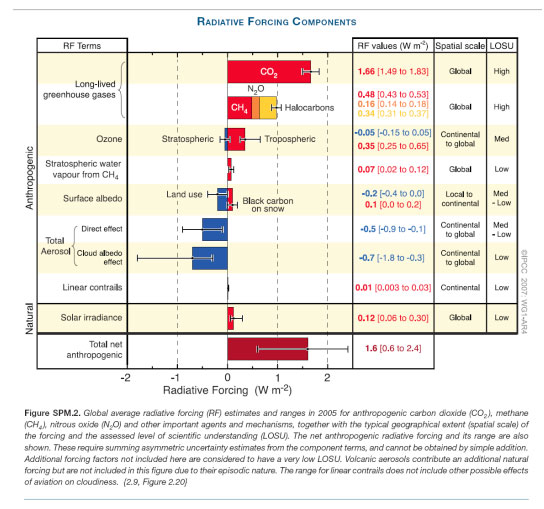
First, the anthropogenic forcings listed in Figure 1, the first of which is the CO2 forcing of 1.66 W m-2, sum to 1.72 W m-2 and are then adjusted by a probability-density function to a net 1.6 W m -2. It is thus quite clear that the value of the CO2 forcing is distinct from, and does not encompass, the values of the other anthropogenic forcings. Secondly, the CO2 forcing value given in Figure 1 may be directly evaluated from the simplest (Myrhe et al., 1998) of the IPCC's three formulae for evaluating the CO2 forcing on its own:
Next, Dr. Smith says that, in my description of the IPCC's method of evaluating climate sensitivity, I had not derived the value of the base or no-feedbacks climate sensitivity parameter κ from two of my equations. Of course not: the first part of my paper merely described and reproduced, with respectable faithfulness, the IPCC's own method of evaluating its central estimate of climate sensitivity.
Accordingly, at this point I merely cited the IPCC's own implicit value κ = 0.313 K W-1m2. With respect, since Dr. Smith admits this is indeed the IPCC's value, it seems less than reasonable that he should describe my own citation of it as an "oddity".
Dr. Smith then uses his erroneous assumption that the IPCC's value for the CO2 forcing alone encompasses the values of all other anthropogenic forcings as the basis for challenging the IPCC's value of κ as somewhat too low. He does not adduce any support for this proposition in the literature.
Dr. Smith moves on to say I was wrong to add the CO2 feedback to the other temperature feedbacks mentioned by the IPCC. However, the mechanism of this feedback is uncontroversial: as temperature increases (for whatever reason), CO2 is outgassed from the oceans in accordance with Henry's Law, increasing the atmospheric concentration and hence causes some additional warming, which reinforces and is reinforced by all other temperature feedbacks, among which the CO2 feedback accordingly belongs.
Dr. Smith's final criticism of my replication of the IPCC's method of evaluating climate sensitivity is that his revisions yielding equilibrium sensitivity ΔT2x = 2.9° K at CO2 doubling more faithfully reproduce the IPCC's central estimate ΔT2x ≈ 3° K than my presentation of the IPCC's methodology does. However, IPCC (2007) gives a more precise central estimate ΔT2x ≈ 3.26° K, so my value ΔT2x ≈ 3.28 K is very much closer than that of Dr. Smith, who does not mention the two checksums that my paper provided. The first, showing base climate sensitivity ΔT κ ≈ 1.1° K, agrees exactly with the equation in the companion paper by Hafemeister & Schwartz (2008), which Dr. Smith unreasonably criticizes. The second checksum reproduces exactly the IPCC's value κ ≈ 0.313 K W-1m2. My presentation of the IPCC's methodology, therefore, is uncontroversial.
Dr. Smith may be forgiven for not having understood the IPCC's method: its presentation of its climate-sensitivity calculations, scattered through several chapters, and with key parameters and equations neither mentioned nor explicitly evaluated, is culpably obscurantist.
Turning to the second part of my paper, Dr. Smith critiques my reconsideration of the values of the three key parameters - forcing ΔF2x, no-feedbacks climate sensitivity κ, and feedbacks f - whose product is final climate sensitivity ΔT2x.
He begins by challenging my assertion that the laboratory experiments in which evaluation of the CO2 forcing is attempted are of limited value when translated into the real atmosphere. He says the 3.7 W m-2 CO2 forcing at doubling is "determined by the underlying physics". If only it were!
One need only recount the history of attempts at evaluating the CO2 forcing to show that this is not so. Hansen (1984) implies 4.8 W m-2; IPCC (1995) gives 4.44 W m-2; IPCC (2001, 2007) gives 3.71 W m-2. Hansen's value is almost one-third higher than the IPCC's current value: the "underlying physics" seem not as certain as Dr. Smith suggests, and the trend is towards lower climate sensitivity.
With the dawning realization that CO2 forcing in the atmosphere is not as well-mannered as that in the laboratory, the IPCC has been quietly reducing its estimates of final climate sensitivity at CO2 doubling: 3.8° C in 1995; 3.5° C in 2001; 3.26° C in 2007.
As we shall see later, the real atmosphere presents many formidable complications, insufficiently taken into account by the IPCC, that give the lie to any simplistic notion that the "underlying physics" can give us an answer that is even in the right ballpark.
Dr. Smith says I was wrong to divide the CO2 forcing by 3 to allow for the fact that half a century of radiosonde observations and 30 years of satellite observations have failed to demonstrate the models' predictions that in the tropical mid-troposphere anthropogenic greenhouse forcings will cause warming at three times the surface rate.
He says I "completely mischaracterize" the tropical mid-troposphere "hot-spot"on the ground that that the "hot-spot" shows in all forcings except those that show it as a "cold-spot".
However, it is necessary only to look at the IPCC's altitude-vs-latitude plots (Figure 2) of the temperature fingerprints of five forcings, and of the five combined, to see that the model-predicted fingerprint of anthropogenic greenhouse forcing dominates all others -
Temperature fingerprints of five forcings
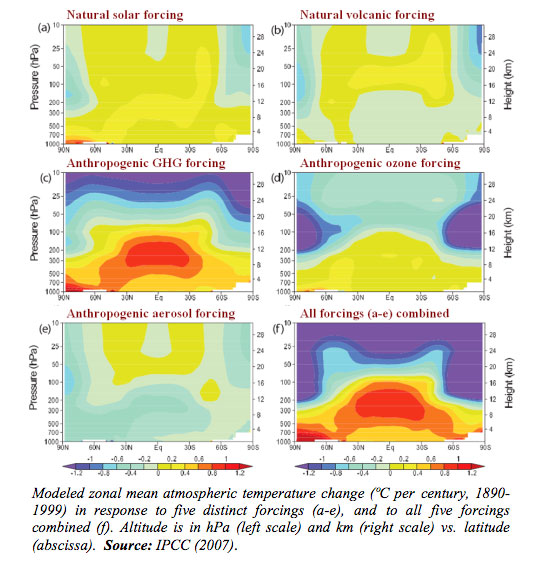
Dr. Smith says that the solar forcing, for instance, is predicted to induce a warming of at least the factor of 2-3 that is predicted for the greenhouse forcing. Perhaps: but elsewhere he cites Hafemeister & Schwartz (2008), who state that solar forcing has been negligible: it is, therefore, irrelevant to a discussion of the "hot spot". It is precisely because the greenhouse forcing is so dominant as to overlay all others in the models that the entire absence of the "hot-spot" is fatal to the IPCC's high climate sensitivity. Because of the predicted magnitude of the anthropogenic greenhouse forcing in comparison with those of all other forcings - demonstrated with blinding clarity in Figure 2 - the absence of the fingerprint necessarily entails either the absence of a sufficient forcing to deliver the fingerprint, or the presence of countervailing forcings so strong as to nullify it. Either way, it would be difficult credibly to maintain the notion of high climate sensitivity in the face of this graphic and serious failure of the models to predict the real climate correctly.
Next, Dr. Smith quibbles that my suggestion that the anthropogenic forcings should be divided by three to take account of the absence of the predicted fingerprint of anthropogenic greenhouse-gas forcing in the tropical mid-troposphere is inappropriate because, if anything, it is the feedbacks that are affected by the absence of the model-predicted "hot-spot". Yet what we are all looking for is final climate sensitivity. Since the answer is the product of three factors, we may divide any one of the three factors by 3 and obtain precisely the same answer as if we had divided any of the others by 3.
Dr. Smith concludes that division of final climate sensitivity by a factor as large as 3 (or at all) is unwarranted: he describes it - more colorfully than scientifically - as an "arbitrary slashing". However, he overlooks the fact that I cited perhaps the world's foremost authority on the behaviour of the atmosphere - Professor Richard Lindzen of MIT - who had sent me some lecture notes on the "hot-spot" problem in which he concluded:
And again, in a paper that the Professor kindly sent to me - On the assumption that all observed warming in the satellite era is anthropogenic (Dr. Smith, after all, says the Sun has little to do with it), Professor Lindzen's statement amounts to a division of final climate sensitivity by at least 3.Next, Dr. Smith says that I ought not to have cited IPCC (2001), which mentioned a value of 0.5 K W-1m2 for the with-feedbacks climate sensitivity parameter λ = κf. However, the value λ = 0.5 K W-1m2 is the only value stated in IPCC (2001), and no value for this parameter is stated in IPCC (2007). Since 0.5 was the only explicitly-stated value, I was entitled to use it by way of illustrating the wide range of values for κ in the literature, the least of which (κ = 0.24 K W-1 m2) follows from λ = 0.5 K W-1 m2, as my paper explains, and the greatest of which is implicit in IPCC (2007). The still greater values imagined by Dr. Smith are not warranted anywhere in the literature, and depend upon his errors in understanding the IPCC's method of quantifying climate sensitivity.
Dr. Smith then wrongly states, based on his earlier error in evaluating f, that the value of κ derivable from λ = 0.5 K W-1 m2 is κ = 0.26 K W-1 m2. My stated value κ = 0.24 K W-1 m2 was correctly evaluated. The value implicit in IPCC (2007), however, is κ = 0.313 K W-1 m2. Dr. Smith says "0.26 and 0.31 are hardly very far apart". With respect, this is not a proposition that a physicist would cheerfully entertain: for f is dependent upon κ, so that λ = κ(1 - 2.16κ)-1. Accordingly, where κ = 0.313, λ is nearly double the value that obtains where κ = 0.24: considerably above the "20% effect at best" that Dr. Smith maintains.
Next, Dr. Smith says I was wrong to say that McKitrick (2007) implied that global temperature change simpliciter had been overstated by a factor of two since 1980. He points out, rightly, that McKitrick's paper refers only to land temperatures. However, I had consulted the Professor before writing about his conclusions, and - if I understood him correctly - he said that the ratio would apply almost equally to global land and sea temperatures, since the datasets were very heavily biased towards land-based measurements.
Dr. Smith says that McKitrick's finding is "hardly an accepted position": however, he does not cite any references to peer-reviewed papers challenging the Professor's analysis. Before writing my paper I had asked the Professor whether any challenge to his analysis had appeared in the literature. He had replied that there had been no challenge either to his 2007 paper nor to an earlier paper that he had authored jointly with Dr. Patrick Michaels, with whom I had discussed the urban-bias problem earlier this year. If Dr. Smith is aware of any challenges in the literature to McKitrick's analysis, I should be grateful to learn of them.
On the feedback factor f, Dr. Smith says I was wrong to say that feedbacks were exaggerated by the IPCC because their maxima summed to a value greater than the point of instability in the Bode feedback-amplification equation. He says that because the water-vapor and partially-compensating lapse-rate feedbacks are closely linked, the uncertainty in their sum is half their individual uncertainties. However, he does not adjust the sum of the feedback maxima to allow this: doing so still places the feedback-sum at the point of instability: ~3.2 W m-2 K-1.
Dr. Smith also overlooks the considerable literature - some of which I had cited - to the effect that the IPCC has substantially overstated the values of individual feedbacks. Nor has he mentioned my point that the IPCC does not assign a "level of scientific understanding" to feedbacks, even though they contribute some two-thirds of the entire effect of a forcing. Uncertainties in evaluating feedbacks are considerable: indeed, it is only in the 2007 report that the IPCC attempts a quantification of feedbacks at all. If Dr. Smith is right that the failure of the models to replicate the behavior of the tropical mid-troposphere correctly would indicate a problem with the IPCC's understanding of feedbacks rather than of forcings, then the problem lies in those uncertainties, which are in reality considerably greater than the narrow error-bars of the IPCC suggest.
Dr. Smith says he assumes the IPCC's error-bars represent "95% certainty intervals". And why must he assume that? Because the IPCC, in this as in so much else, does not make the matter explicit. It has been widely criticized because elsewhere in its reports it has adopted 90% confidence intervals rather than the usual 95% or two standard deviations. The key point is that even the IPCC's central feedback estimates are too close to instability to conform to observation: the climate in practice is - and has been for billennia - far less unstable than the IPCC's high feedback estimates imply.
Finally, Dr. Smith sneers (ad hominem being never far from the surface of his letter) that perhaps I am unaware that non-linear systems can be linearized under small perturbations. However, Bode (1945) is very clear in stating that his feedback-amplification equation is designed only for objects whose initial state is linear; and a climate object beset by feedbacks of the magnitude imagined by the IPCC is certainly too far from linearity to be linearized. Perhaps Dr. Smith is unaware that the climate object is not merely complex and non-linear (IPCC, 2001) but also, in the formal, mathematical sense, chaotic (IPCC, 2001; Lorenz, 1963): and one certainly cannot reliably linearize a chaotic object, particularly when its initial state cannot be known to a sufficient precision even to define it, still less to predict the nature, moment of onset, the duration, or the magnitude of the future phase-transitions that militate against linearization and, indeed, against computer modeling such as that which is the entire basis of the IPCC's case.
Dr. Smith says that the IPCC's feedback values are evaluated "to the extent that computational limitations allow". No doubt they are: though the complexity of the models should not be allowed to conceal the magnitude of the guesswork involved in evaluating feedbacks. But that is not the point. It is only when one has arrived at one's guesstimates of the base values of the individual climate feedbacks that it is possible to pass their sum through the feedback-amplification equation. However accurate the IPCC's guesses, the Bode equation was in no way designed for, and remains fundamentally inappropriate for, amplication of feedbacks in a chaotic object.
Next, Dr. Smith criticizes my taking the water-vapor feedback as an instance of a feedback that is itself non-linear, on the superficially plausible ground that water vapor concentration increases near-exponentially, while the consequent forcing effect increases logarithmically. Under ideal conditions, linearity would of course result. However, in real physics and in the real atmosphere, we cannot be sure that linearity results. Let us deal with the physics first. The Clausius-Clapeyron relation is, as I correctly stated in my paper, not exponential but near-exponential: there is a weak dependence upon temperature in the denominator. And, in the real atmosphere, the logarithmicity of the forcing that arises from an increase in water vapor is not rigorous: like that of the CO2 forcing, it is a rule-of-thumb attempt to simplify a complex phenomenon, in which a multiplicity of radiative processes and non-radiative transports interfere with one another. Whether in physics or in the real atmosphere, there is no basis for assuming that everything will cancel out nicely and that the water-vapor feedback - or any other feedback - will be linear.
In conclusion, Dr. Smith's criticisms of my paper are superficially ingenious but in reality unmeritorious. Objectively speaking, the IPCC's method of evaluating climate sensitivity, which is faithfully, concisely, and correctly expounded in the first part of my paper, suffers from multiple exaggerations and contains serious conceptual flaws - such as the abuse of the Bode equation - and is subject to uncertainties whose combined effect is so great as to render meaningless its 2007 conclusion that, to a 90% confidence interval, we have been responsible for more than half of the warming that may have occurred over the past half-century, and which ceased with the great el Nino of 1998.
Were we to be permitted to stray from the mathematics and physics just for a fleeting instant, we might say of the IPCC's conclusions what Pope Innocent X said of the Treaty of Westphalia - that they are "null, void, invalid, iniquitous, unjust, damnable, reprobate, inane, and empty of meaning for all time."
Monckton of Brenchley
Carie, Rannoch, PH17 2QJ, Scotland
monckton@mail.com
24 July 2008
References
BODE, H.W. 1945. Network analysis and feedback amplifier design. 551pp. Van Nostrand, New York.
HAFEMEISTER, David, and Peter Schwartz. 2008. A Tutorial on the Basic Physics of Climate Change. Physics and Society >b>37, 3: 3-6.
HANSEN, J., Lacis, A., Rind, D., Russell, G., Stone, P., Fung, I., Ruedy, R., and Lerner, J. 1984. Climate sensitivity: analysis of feedback mechanisms. Meteorological Monographs 29: 130-163.
IPCC. 1995. The Science of Climate Change: Contribution of Working Group I to the Second Assessment Report of the Intergovernmental Panel on Climate Change [J. T. Houghton et al., (eds.)], Cambridge University Press, London.
IPCC. 2001. Climate Change, The Scientific Basis. Contribution of Working Group I to the Third Assessment Report of the Intergovernmental Panel on Climate Change. Cambridge University Press, London.
IPCC. 2007. Climate Change 2007: The Physical Science Basis. Contribution of Working Group I to the Fourth Assessment Report of the Intergovernmental Panel on Climate Change [Solomon, S., D. Qin, M. Manning, Z. Chen, M. Marquis, K.B. Avery, M. Tignor and H.L. Miller (eds.)]. Cambridge University Press, London.
LINDZEN, R.S. 2007. Taking greenhouse warming seriously. Energy & Environment 18 (7-8): 937-950.
LORENZ, Edward N. 1963. Deterministic nonperiodic flow. Journal of the Atmospheric Sciences 20: 130-141.
McKITRICK, R.R. 2007. Quantifying the influence of anthropogenic surface processes and inhomogeneities on global gridded climate data. J. Geophys. Res. (Atmospheres) [in press].
MONCKTON OF BRENCHLEY, Christopher. 2008. Climate Sensitivity Reconsidered. Physics and Society, 37, 3: 3-6.
MYRHE, G., Highwood, E.J., Shine, K. P., and Stordal, F. 1998. New estimates of radiative forcing due to well-mixed greenhouse gases. Geophys. Res. Lett. 25 (14): 2715-2718.