Topic category: Elections - Politics, Polling, etc.
Is The Presidential Polling Narrative Accurate?
The standard narrative of Hillary Clinton’s news media friends asserts Clinton has had a virtual lock on the Presidency, if not from the outset, then certainly since the nominating conventions ended. A constant reinforcement of that narrative with periodic polling data should convince people the narrative is true. But what happens when polling data actually contradict the narrative?
Whether or not you supported Hillary Clinton or Donald Trump, at the end of August who did you believe would be elected President? If you ask most people that question, an overwhelming majority will say Hillary Clinton. After all, didn’t the narrative regularly inform us that Clinton held commanding leads among African-American voters, Hispanic voters, and women voters? Weren’t we informed Clinton had an insurmountable Electoral College lead?
But is the news media narrative accurate?
At least one well-respected poll suggests the news media narrative is as honest as Hillary Clinton’s responses to direct questions!
The LA Times/USC Daily Tracking Poll began reporting daily results on July 10. A representative group of 5500 people across the nation provide a pool of registered voters, one-seventh of whom are randomly sampled by zip code each day. Data are gathered electronically over the internet. Each daily poll number is an average of the prior week’s daily polling. The methodology used was developed for the successful RAND Continuous Presidential Election Poll.
Derived from the LA Times/USC Daily Tracking Poll data, five figures clearly illustrate the deeply-flawed nature of the narrative that Clinton has been leading in the polls and will prevail on November 8.
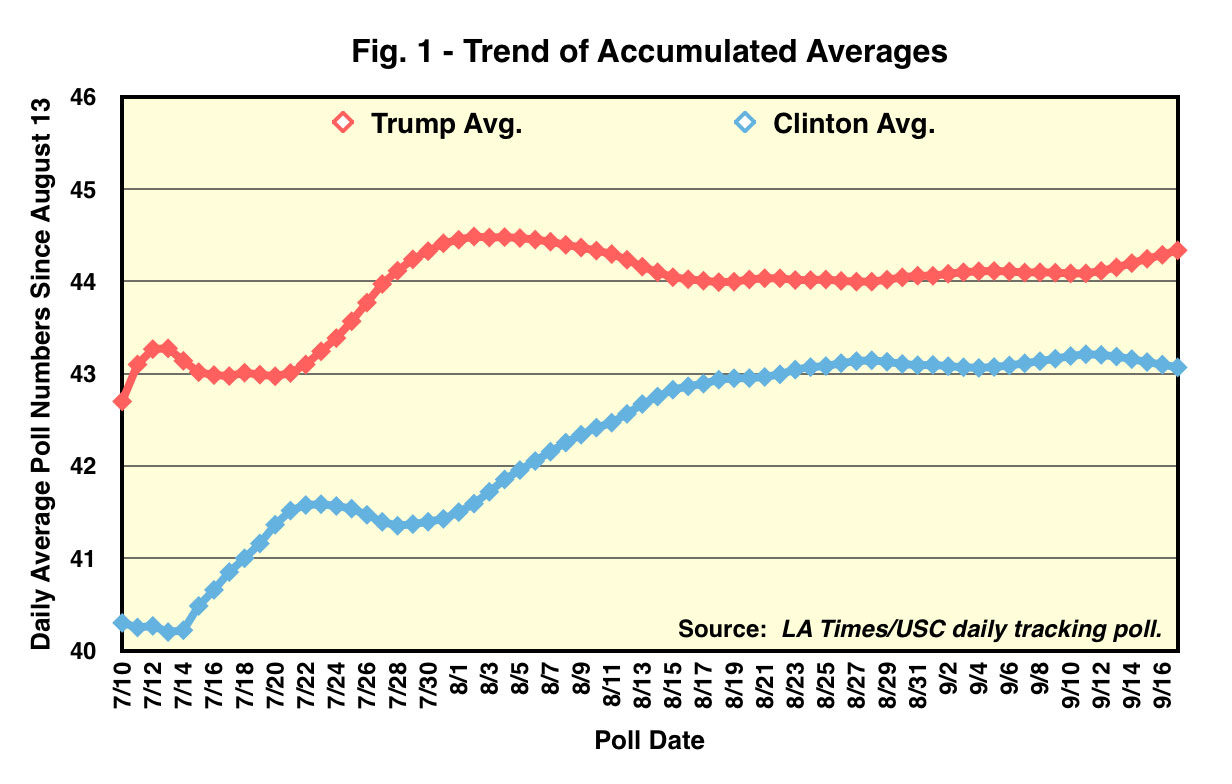
Figure 1 - Trend of Accumulated Averages
For each candidate, Figure 1 shows their respective accumulated average poll number to date. Each poll number used to compute the average is itself based on a week’s average of polling.
Moving forward in time (to the right), each point on the curve represents a larger data sample and will consequently require a more significant shift in polling data to alter the average. This is evident from the shape of the curves for both Trump and Clinton. There are big shifts early in polling and as polling progresses it becomes more difficult to shift the averages. Therefore, any notable shift represents a significant movement in the polls.
Two things are evident from this chart:
Figure 2 - Smoothed Daily Tracking Poll Since July 10
This figure is a smooth curve plot of the daily tracking poll data since July 10, the first day data were provided.
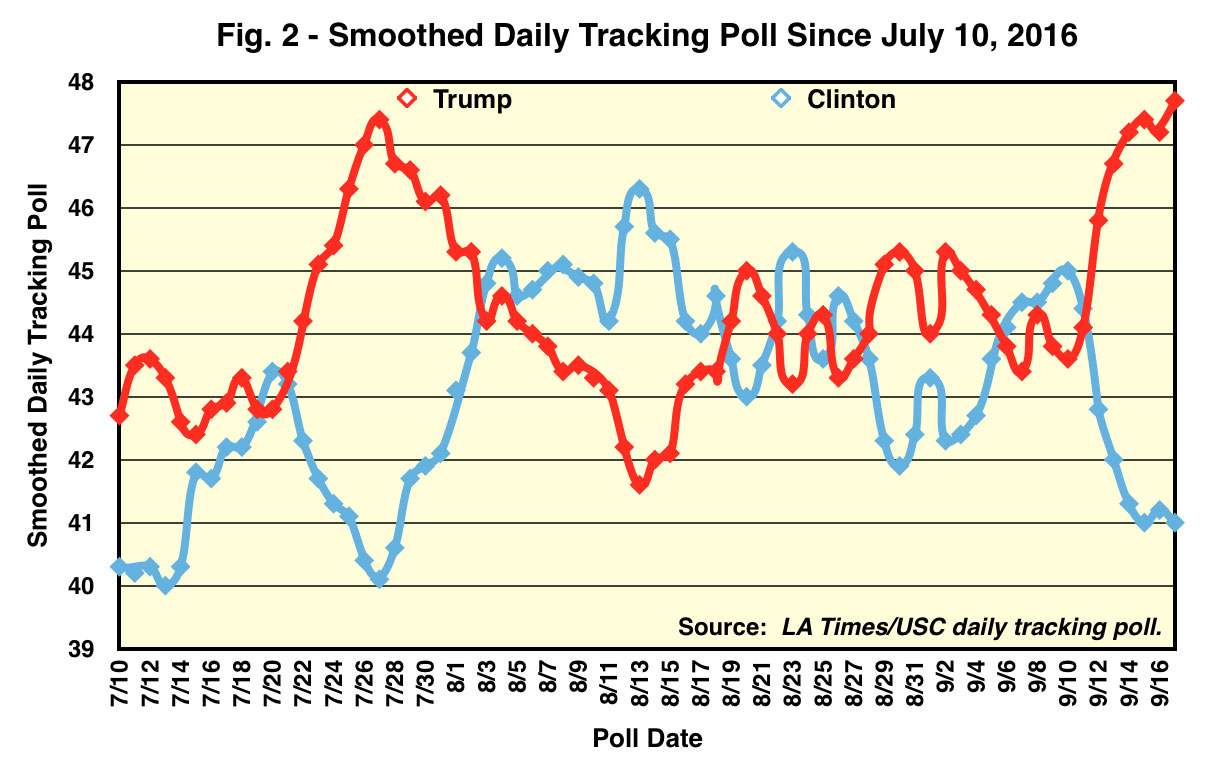
These curves show:
Figure 3 - Trend of Deviation of Daily Poll Number from Current Average
This figure plots the deviation of each candidate’s daily poll number from their average poll number to date. Negative deviations indicate slipping in the polls, positive deviations indicate improving poll numbers.
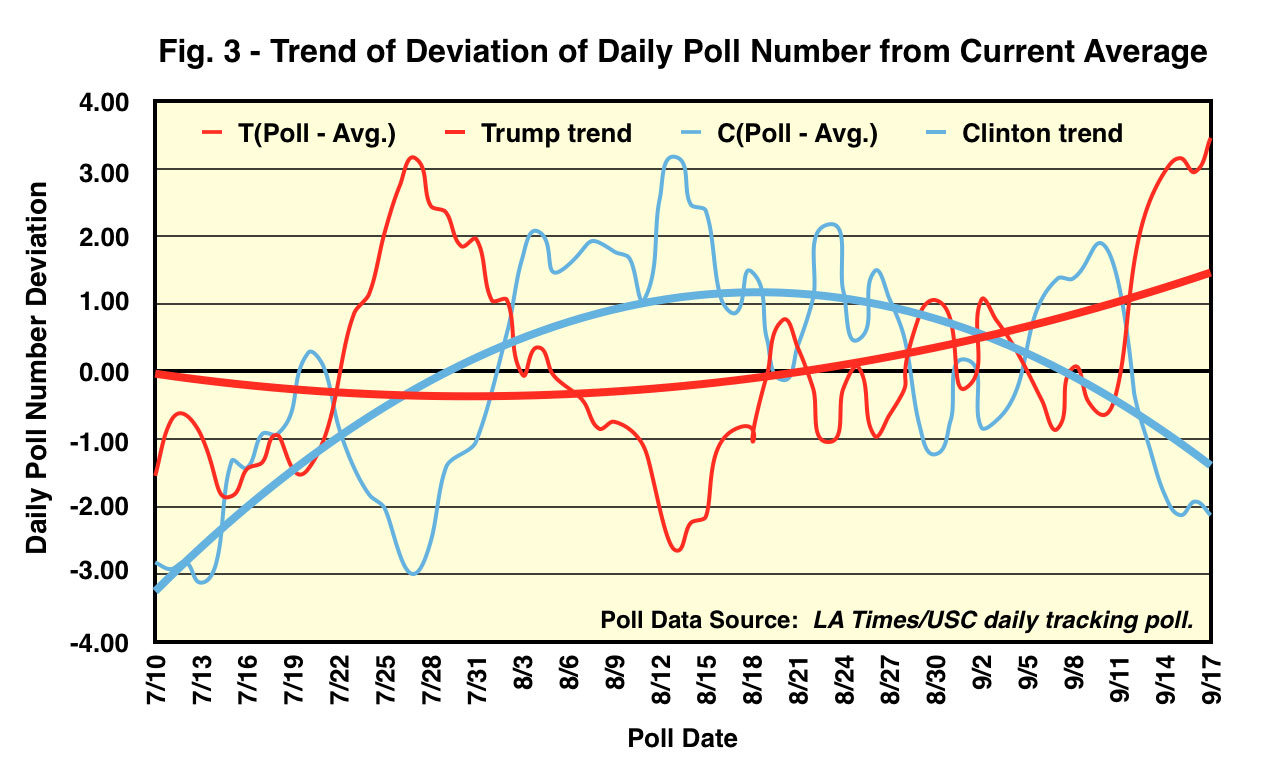
A trend curve is added to illustrate each candidate’s poll momentum in terms of their slipping or improving in the polls from their current long-term average. The poll momentum clearly favors Trump’s position, suggesting he will continue to improve while Clinton continues to slide.
The narrative of Clinton’s supremacy in the polls is contradicted once again.
Figure 4 - History and Trend of Trump Leading Clinton
This figure plots the daily difference between Trump’s poll number and Clinton’s poll number. Negative values indicate Clinton leading in the polls, positive values indicate Trump leading in the polls.
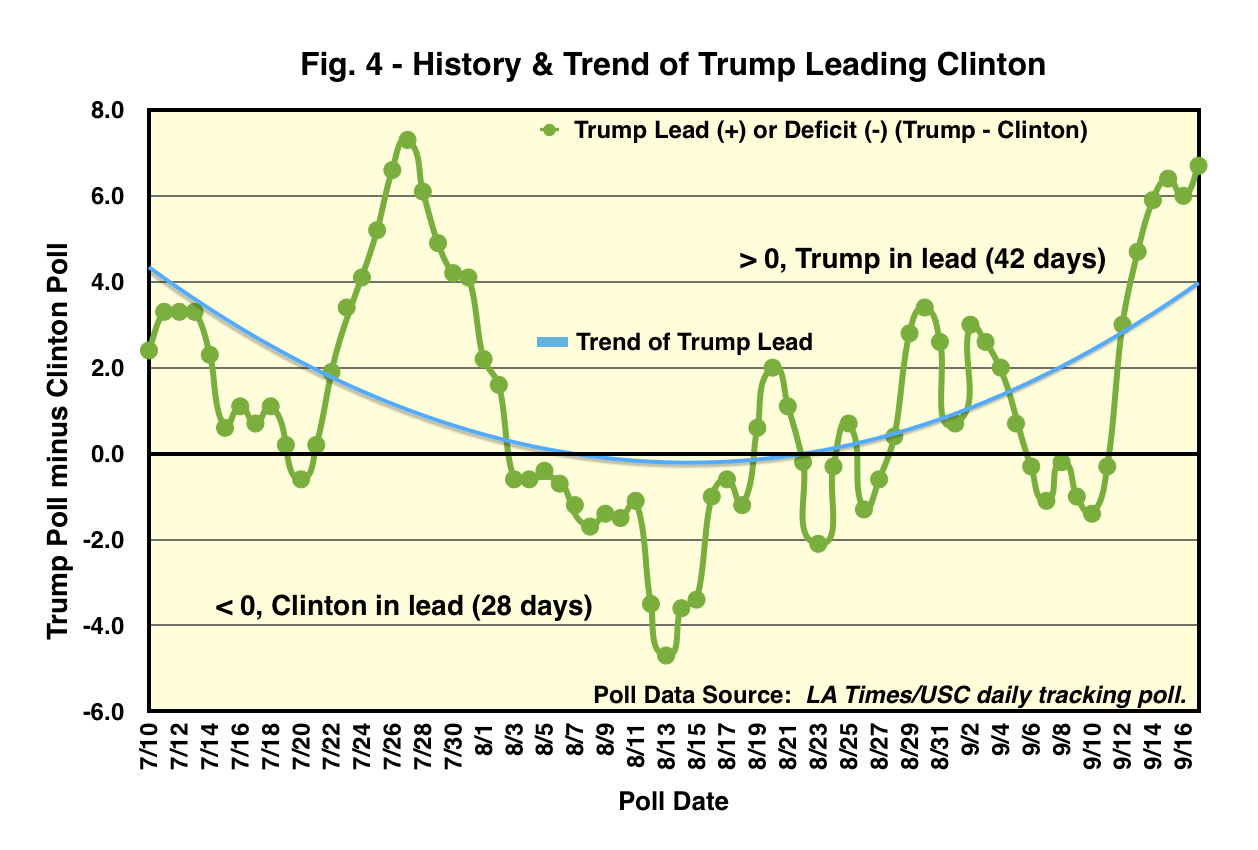
The current strong surge by Trump concurrently with Clinton’s collapsing poll numbers are evident with the trend (in blue).
In clear defiance of the polling narrative, these poll data clearly show Trump has held the lead for 42 days while Clinton has had the lead for just 28 days since polling was first reported on July 10. It’s hard to sustain the credibility of a narrative that claims the candidate who has been ahead 60% of the time covered by the poll and who is now surging strongly in the polls is the weaker candidate who is doomed to lose in November.
Figure 5 - Percent of Poll Days When Trump Outpolled Clinton
For each date, the percent of days when Trump lead Clinton up to and including that date is plotted. Today’s date shows Trump having lead Clinton during 60% of all dates.
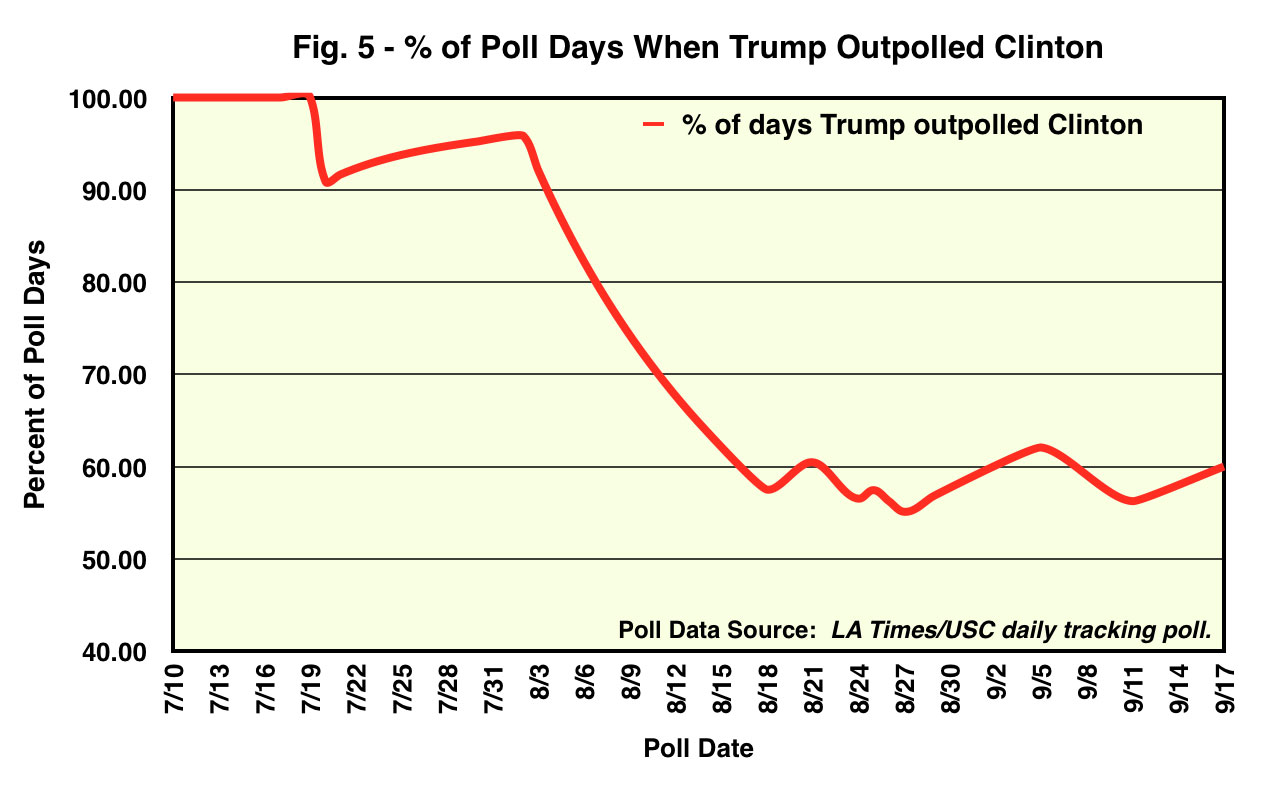
Trump’s lowest performance was on August 27 when he had led Clinton only 55% of the time since polling began. Yet again, this indicator contradicts the narrative.
Demographics
Another interesting aspect of Trump’s current surge is indicated in the demographic data. As of Sunday:
It is clear that Trump is enjoying a strong surge in polling across a wide diversity of demographics and has commanding leads among several dominating demographics.
Added to the motivation behind voters who are fed up with “politics as usual”, the dynamics of this election appear to strongly favor the election of Donald J. Trump. In short, the narrative that Hillary Clinton is likely to win in November is completely without foundation.
Barring some event that causes a massive reversal of polling dynamics between now and November 8, there is not likely to be a shift toward Hillary Clinton.
Bob Webster
WEBCommentary (Editor, Publisher)
Biography - Bob Webster
Author of "Looking Out the Window", an evidence-based examination of the "climate change" issue, Bob Webster, is a 12th-generation descendent of both the Darte family (Connecticut, 1630s) and the Webster family (Massachusetts, 1630s). He is a descendant of Daniel Webster's father, Revolutionary War patriot Ebenezer Webster, who served with General Washington. Bob has always had a strong interest in early American history, our Constitution, U.S. politics, and law. Politically he is a constitutional republican with objectivist and libertarian roots. He has faith in the ultimate triumph of truth and reason over deception and emotion. He is a strong believer in our Constitution as written and views the abandonment of constitutional restraint by the regressive Progressive movement as a great danger to our Republic. His favorite novel is Atlas Shrugged by Ayn Rand and believes it should be required reading for all high school students so they can appreciate the cost of tolerating the growth of unconstitutional crushingly powerful central government. He strongly believes, as our Constitution enshrines, that the interests of the individual should be held superior to the interests of the state.
A lifelong interest in meteorology and climatology spurred his strong interest in science. Bob earned his degree in Mathematics at Virginia Tech, graduating in 1964.