Topic category: Healthy Living & Health Care Issues
WHO is MANIPULATING the RECORDS of WORLDWIDE DAILY NEW WUHAN CORONAVIRUS CASES? And why? An implausible alteration of 11 days of records in April demands a serious explanation
The Center for Systems Science and Engineering (CSSE) at Johns Hopkins University (JHU) maintains an online "Dashboard" to track the worldwide progress of the Wuhan coronavirus by recording each days' worldwide number of new cases. The record has been maintained for nearly three months and each day the prior two days have been subject to upward adjustments as updated reports come in to make the records complete. But what plausible explanation is there for sudden significant changes (including a large reduction) in daily new cases for an 11-day string of dates in the past that shifted the peak of the pandemic eight days later than originally reported?
Johns Hopkins University maintains a Wuhan coronavirus daily tracking website (Dashboard) to help track the progress of the worldwide pandemic. This extremely helpful website tracks various figures relating to the worldwide Wuhan coronavirus pandemic (e.g., cumulative confirmed cases, daily new cases, deaths, active cases, incidence rate, etc.).
According to the webpage, the data sources are "WHO, CDC, ECDC, NHC, DXY, 1point3acres, Worldometers.info, BNO, the COVID Tracking Project (testing and hospitalizations), state and national government health departments, and local media reports."
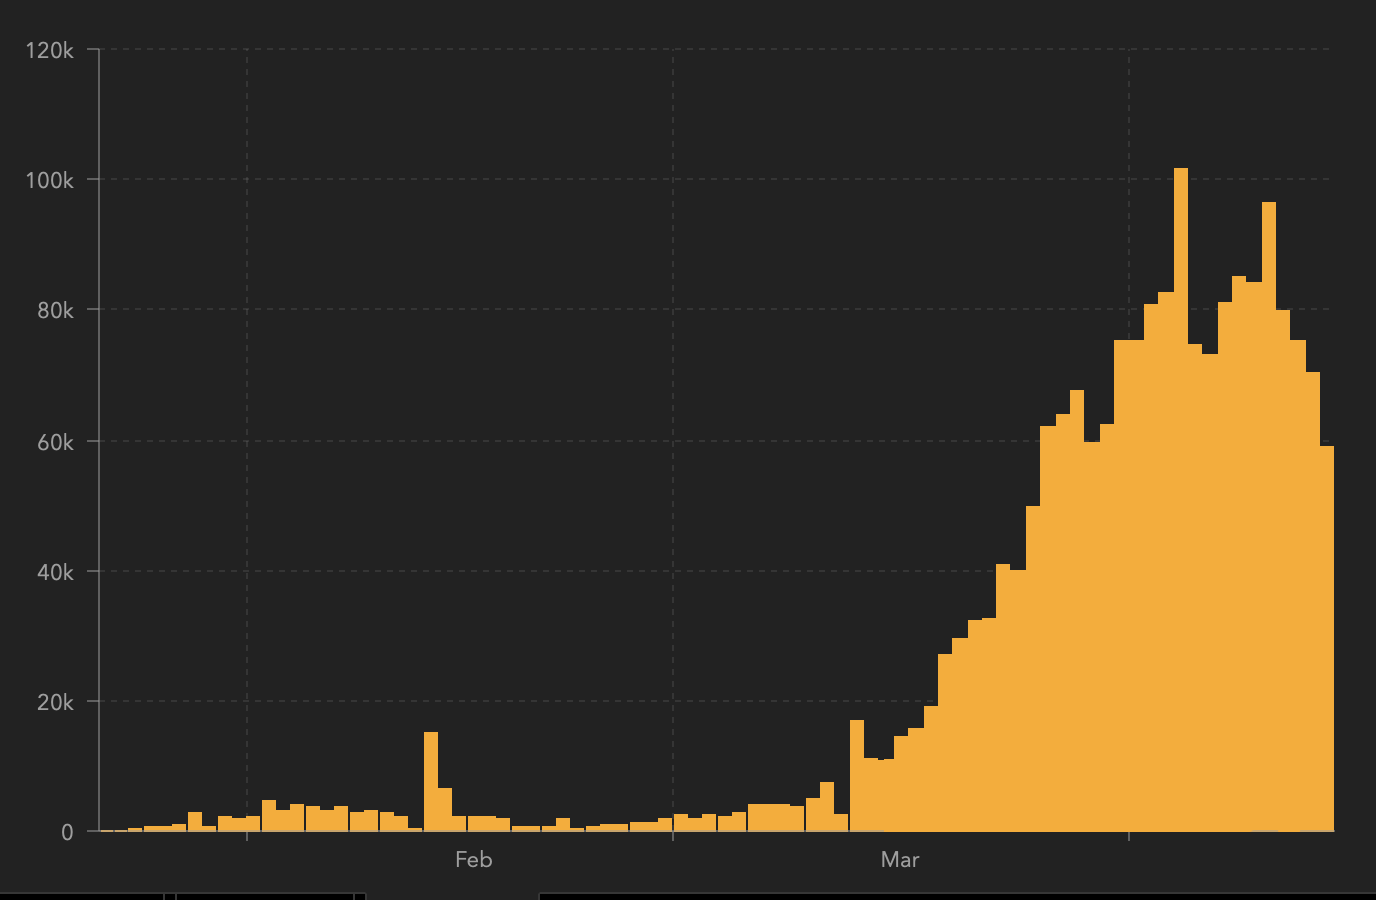
Of particular value is a bar chart (examples below) that provides a history of worldwide daily total new cases of the virus. The daily new cases are critical to determining the "apex" of the spread of the virus, that is, the peak number of cases worldwide. Past research indicates daily new cases generally folow a Gaussian (bell-shaped curve) distribution (also known as a "Normal" distribution). Thus the record of daily new cases should provide a clear indicator of when the worst is past and daily new cases begin a more rapid decline.
Because it is such an important statistic, it is vitally important that the record of worldwide daily new cases not be corrupted and be as accurate as reasonably possible.
Tracking this indicator of the virus' progress revealed a clear peak day of worldwide new cases on April 4th. This peak was confirmed over the next 11 days as April 10 through April 14 showed the expected decline of the virus on the downside of the bell-shaped history of daily new cases:
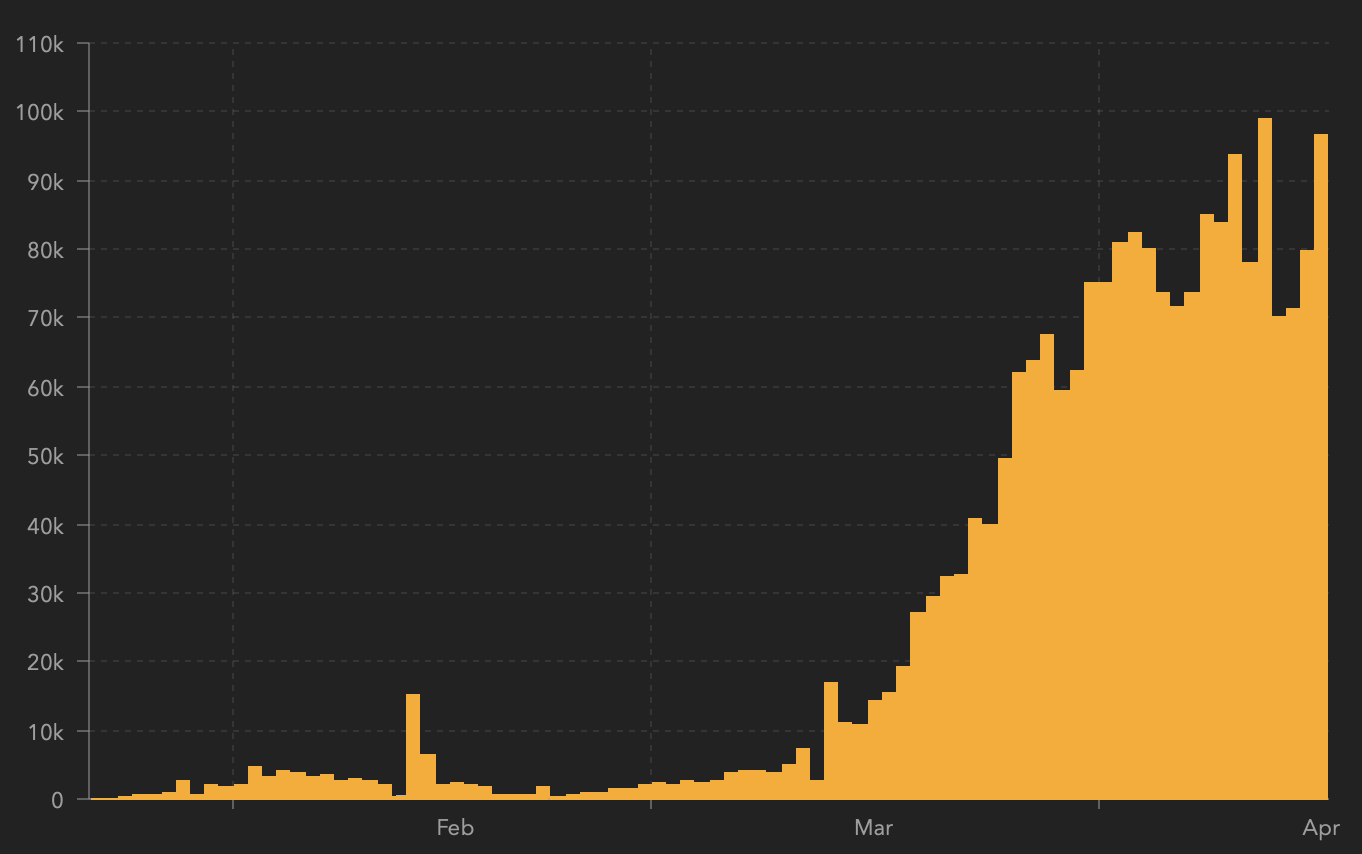
But a dramatic change was observed two days later when the updated daily new cases chart showed:
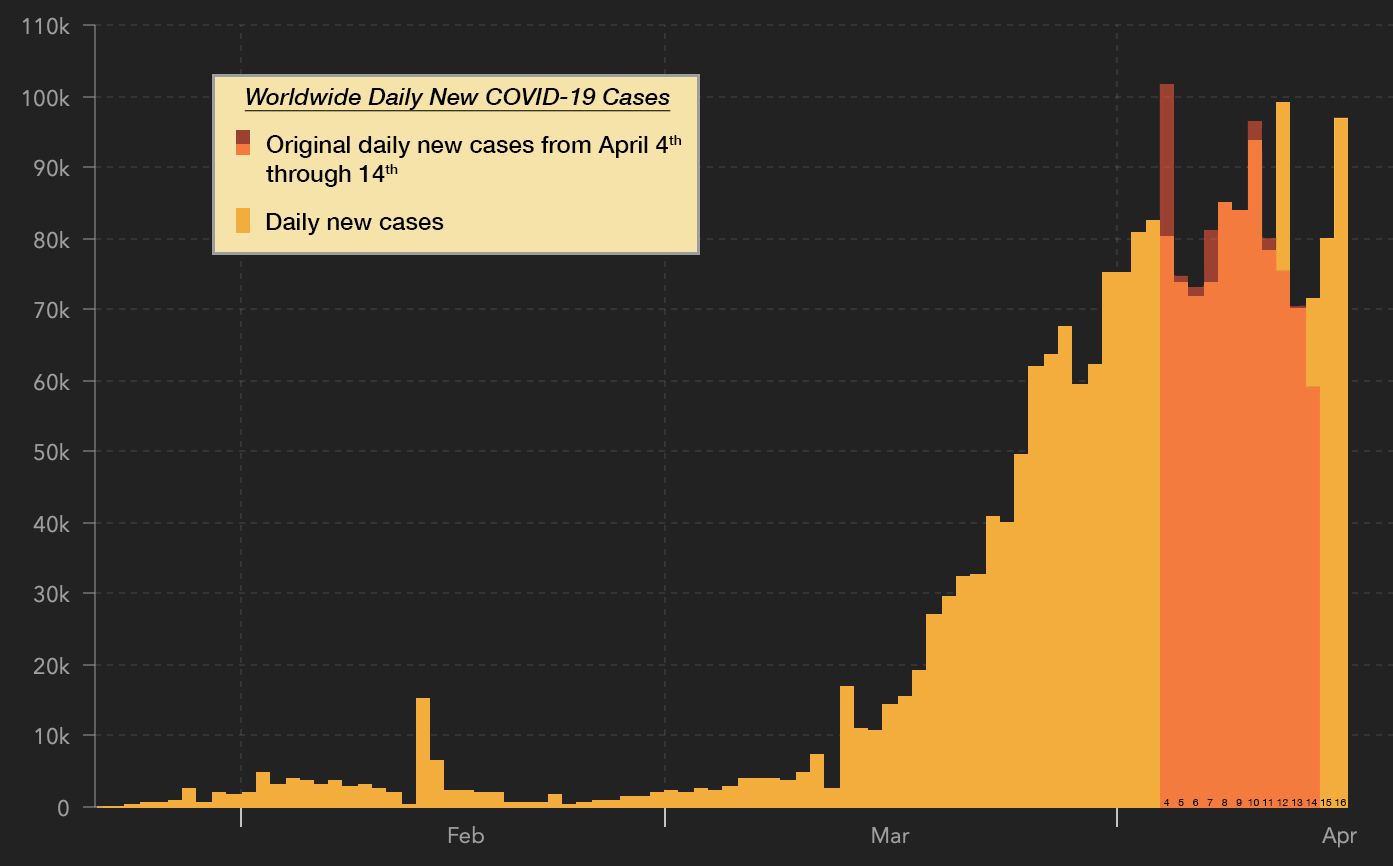
Note how the shape of the trend defined by the bar tips had dramatically changed! Gone and dramatically reduced was the peak of daily new cases on April 4th! Indeed, for each day, April 4 through April 14, the daily new case totals had changed without explanation and some of those changes were dramatic! The peak number of new cases on April 4th had been shifted by eight days to April 12th and the new peak was not quite as high as the previously-recorded peak on April 4th:
The semi-transparent red-tinted bars are overlaid on the newly-altered base to show the original record for those dates prior to the records being altered sometime between April 14 and April 16. Note that six of the red tinted bars extend above the revised record, meaning for six of the 11 adjusted days the prior record of daily new cases had been reduced, implausible for a routine adjustment!
In addition to the peak of daily new cases being shifted eight days into the future, the declilning daily new cases previously observed during the four days from April 10 through April 14 had been wiped out and replaced with growing daily new cases during the four days from April 13 through April 16.
What possible explanation could exist for this bizarre 11-day alteration of the record of daily new cases? It cannot be explained by additional cases being found and added because six of the 11 adjusted dates had their number of new cases lowered. How does that happen?
Is this the same kind of data manipulation used to adjust climate records by "homogenizing" those records to try to make them fit the theory when, prior to homogenization, the records strongly invalidated the theory? Does modern science take the position that, if the records don't support the desired narrative, alter the records to support the narrative?
This change is crucial because it shifts the apparent duration of the pandemic, pushing the peak of the pandemic at least eight days into the future while delaying the appearance of a strong decline in worldwide daily new cases.
We don't know what to make of these changes because no explanation for the changes has been noted on the chart.
Had there been an unlikely major foul-up collecting and reporting the daily new cases for just those 11 consecutive days in April? If so, what caused the foul-up, how was it detected, and what is the basis for the adjustments made?
Or is there a more sinister explanation? Did someone, fuming from President Trump's criticism of WHO, decide to alter 11 days of the record to erase the earlier peak and obscure the downside trend that had existed prior to record alterations? This would have the effect of obscuring the appearance of the peak of the pandemic and delaying evidence the pandemic is collapsing. It would also suggest ongoing data manipulation to support the altered record that erased the sharp decline (previously observed from April 10 through April 14).
Who knows? The lack of a plausible explanation for such a dramatic alteration of the records invites speculation.
It is incumbent upon those responsible for the integrity of this webpage to provide a lucid, plausible explanation for this bizarre alteration of the records.
I've emailed Prof. Lauren Gardner (responsible for this virus-tracking webpage) for a plausible explanation. I'll share her response if and when I receive an explanation.
Meanwhile, I've suspended my faith in the accuracy of the record this webpage is producing. In the absence of a clear and reasonable explanation, this source of pandemic records can no longer be trusted to be accurate.
Author of "Looking Out the Window", an evidence-based examination of the "climate change" issue, Bob Webster, is a 12th-generation descendent of both the Darte family (Connecticut, 1630s) and the Webster family (Massachusetts, 1630s). He is a descendant of Daniel Webster's father, Revolutionary War patriot Ebenezer Webster, who served with General Washington. Bob has always had a strong interest in early American history, our Constitution, U.S. politics, and law. Politically he is a constitutional republican with objectivist and libertarian roots. He has faith in the ultimate triumph of truth and reason over deception and emotion. He is a strong believer in our Constitution as written and views the abandonment of constitutional restraint by the regressive Progressive movement as a great danger to our Republic. His favorite novel is Atlas Shrugged by Ayn Rand and believes it should be required reading for all high school students so they can appreciate the cost of tolerating the growth of unconstitutional crushingly powerful central government. He strongly believes, as our Constitution enshrines, that the interests of the individual should be held superior to the interests of the state.
A lifelong interest in meteorology and climatology spurred his strong interest in science. Bob earned his degree in Mathematics at Virginia Tech, graduating in 1964.